I had to investigate a memory leak in an application I am building for my client. It is a MDI application using DevExpress XtraTabbedMdiManager that provides some MDI eyecandy. Anyway, I’ve used ANTS Memory Profiler (an excellent profiler, highly recommended) for my mission. I have soon found the cause of the true memory leak, which wasn’t an actual memory leak but rather a feature of the application – it was logging events in the memory.
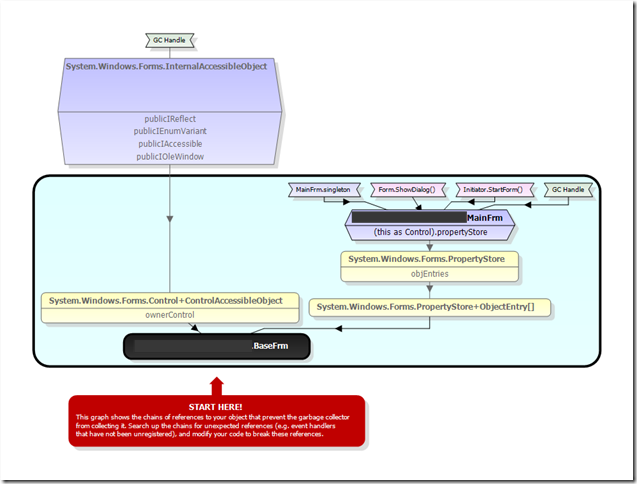
One thing puzzled me though. I’ve tried this scenario. Take a memory snapshot, open a MDI child form, close it and take another snapshot. There shouldn’t be any memory leak, should it? But it was. ANTS Memory Profiler reported that the form wasn’t disposed and still held in memory. So I went looking at the Object Retention Graph for the form in question only to see this image (sensitive namespace is removed in Paint.net):
Is is pretty much obvious that there are two references holding my should-be-disposed form. One is from InternalAccessibleObject and the other one is from Form.PropertyStore. Neither is caused by application’s code. So, what’s going on? It turns out that this is a feature of .net framework MDI and not a real memory leak – it stores the last reference of the active MDI child form or something like that and thus the last form isn’t released. If you repeat the open form/close step the memory leak shouldn’t increase. In fact even the memory leak from the first step is cured.
Even though it is not a true memory leak it is a distractive feature when it comes to memory profiling – for any .net memory profiler, not just ANTS. I guess only experience helps you with these kind of distractions when hunting for a real memory leak.
See also this thread in ANTS Memory Profiler support forum.
