Working with default DirectX configuration in a Visual Studio project is like working with a black box. Even more so when you have a managed code project. Mostly you’ll get an ArgumentException saying “Additional information: Value does not fall within the expected range.” or something like that, almost totally not helpful. But fear not, there is a way to capture a ton of useful information right into Visual Studio’s Debug output window. And here is how:
0. I assume you have DirectX SDK already installed.
If not download if it from DirectX Developer Center.
1. Enable debug output in DirectX control panel
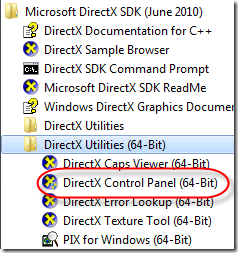
a) Go to Start/All Programs/Microsoft DirectX SDK ([Month] [Year])/DirectX Utilities [(64-bit)] and run DirectX Control Panel [(64-bit)]
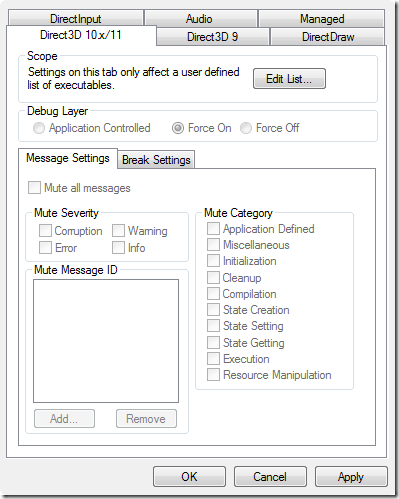
b) Go to Direct3D 10.x/11 tab. Except for the Edit List… button everything is disabled. The reason is that you have to add applications you wish to debug beforehand you can alter the settings (this is not obvious and UI is really clumsy here).
c) Click Edit List… and add your application to the List of process or folders. Clicking on […] button and selecting application exe file does the trick. Click OK button to close this window.
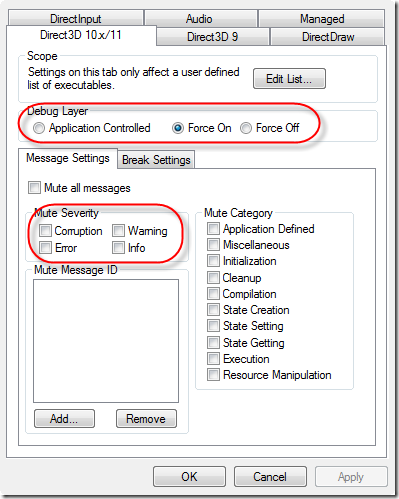
d) Next step is to actually enable debugging of the application. This can be done in two ways – either select Debug Layer’s Force On or switch on debugging directly from code (shown later in step 2.). You can select which messages won’t be displayed through Mute settings.
2. Alternatively to enabling debugging from step 2d)
You can create the DirectX device in code with CreateDeviceOptions.Debug option, like the code below when using managed code and Windows API Codepack:
D3DDevice device = D3DDevice.CreateDevice(null, DriverType.Hardware, null, CreateDeviceOptions.SingleThreaded | CreateDeviceOptions.Debug, levels);
This option will work with both Applications Controlled and Force On Debug Layer settings but not with Force Off.
3. Enable unmanaged debug output in Visual Studio project
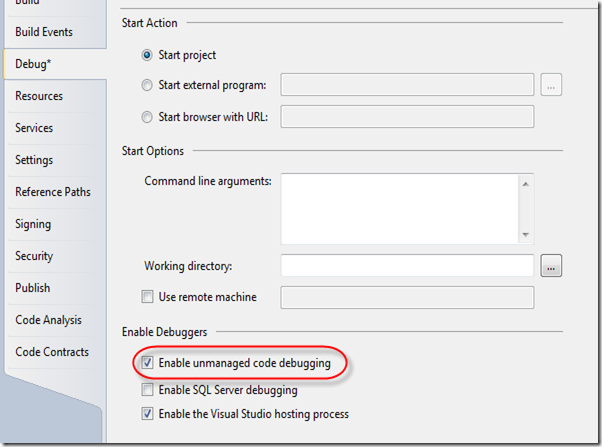
The final step is to allow showing unmanaged debug output in Visual Studio debug output window. This works by default in an unmanaged project but not in managed projects. Note that it is a per-project setting.
Open project properties, Debug tab and make sure that Enable unmanaged code debugging option is checked.
Here you go. You’ll see plenty of DirectX messages in Debug output window from DirectX such as:


Great post !!!
Very Helpful for me !!!
But…
What' that VS version ? 2010 ? 2012 ?
At the time it was 2010 but it should work with 2012 as well.
Great post !
Very Helpful !
But I can't see Info in my output window.
I want to know MEMORY LEAK…But I CAN'T know this…
Please let me know…..
You don't see anything or just specific info?
Is this managed project ?
I can't find that project properties…
Can ONLY see Debug info in managed project ?