.net reflector
I am sure we all know and love .net reflector originally developed by Lutz Roeder and took over by fine folks at Red Gate. If you don’t know what .net reflector is or what it does you must take a look. It is an indispensible tool for understanding how a certain assembly (i.e. from .net framework or 3rd party) works – .net reflector does that by disassembling assemblies into C#/VB/IL/whatever (whatever code is achieved through a right plugin) code you want. And based on all this information it can provide you a ton of useful data, i.e. who uses which type, what types are derived from a type, etc.
.net reflector pro
And now there is a PRO version with a kick ass feature – it lets you step through source code even for referenced assemblies without sources while debugging an application under Visual Studio 2005/2008/2010. The functionality is similar to using symbols for same purposes. But it is a lot better because you aren’t constrained to assembly vendor as vendor has to provide symbol files for you to debug them. .net reflector pro does the trick for any assembly, regardless of the origin. True, it is useless with obfuscated assemblies and it doesn’t provide comments but hey – AFAIK right now there is only Microsoft providing some, not all, symbol files. You are out of luck for other Microsoft and 3rd party assemblies in this case.
Let me tell you an example. I’ve been bugging Developer Express guys for a while to provide symbol files and they probably will, but who knows when because this task is a low priority one for them. Now, with .net reflector pro I don’t need those files anymore nor I need any other 3rd party vendor symbol files.
The question is why would I want this feature at all?
This question should be asked only by a beginner. Everybody that did some serious development knows how important is to understand how a certain feature in a certain assembly is working, specially when you are presented an exception dialog and you have to understand what happened, what went wrong. Normally if you try digging the call stack to show code some code below your methods
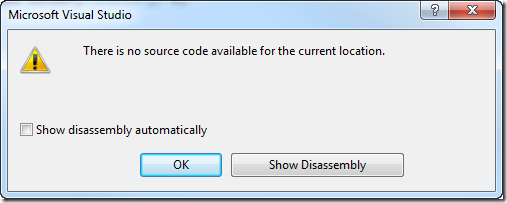
(double click on a method where you don’t have source code – almost all call stack is gray meaning there is no source code available) you are presented with this informative dialog:
Go ahead, if you are an assembler guy, click Show Disassembly. For mere mortals disassembler code is useless.
How to use .net reflector pro
Download early access program version from .net reflector pro forum, unzip it somewhere and run reflector.exe. By running the executable for at least once you will register the Visual Studio addin that integrates .net reflector pro into Visual Studio. Without the addin registered nothing will happen in Visual Studio.
Run Visual Studio. Take note that there is a new root menu entry – .NET Reflector. Next create a test application – mine will be a WinForms one hosting a single SimpleButton from DevExpress. I’ll implement its Click event and put a breakpoint there. No additional code.
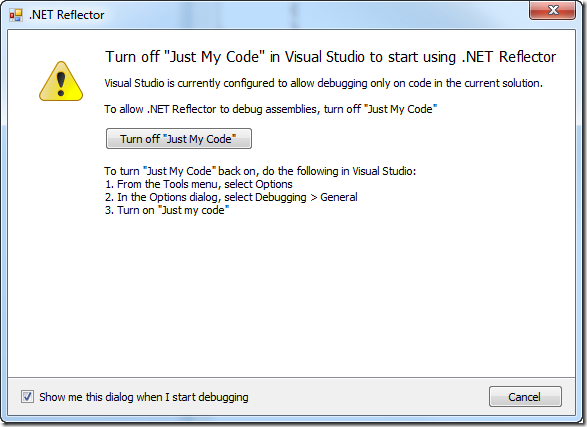
Run the application. If you have turned on Just My Code debugging setting then you’ll be prompted by a .net reflector dialog like this:
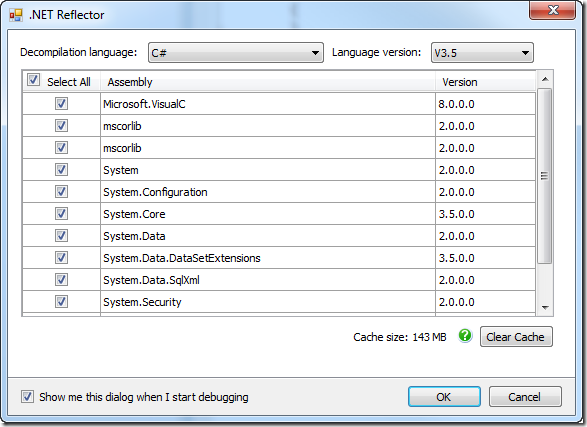
You have to turn off Just My Code feature. This is the same restriction as with symbol files. Then you’ll be presented another dialog where you can select which assemblies are you interested in:
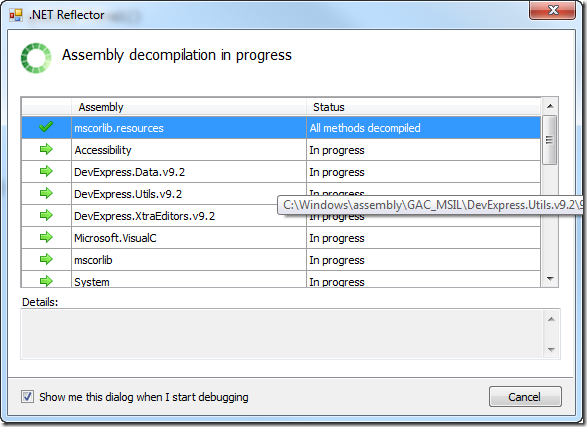
Select all assemblies. Once you hit OK button .net reflector will start decompiling assemblies by using all available cores on the computer (note that there are many entries in “In progress” state running in parallel).
This is the first application I use that actually use all of my Core i7 4+4 cores. Good job and very smart because decompiling so many assemblies even in parallel takes a around 10 minutes on my Core i7 920 computer. But don’t fear – the results are cached and next run there is almost no performance hit at the start. That’s it for configuration and single window application will finally run.
The application will present a default window with a single button. Click on the button and execution will hit a breakpoint you’ve put in button’s Click handler. Look at the call stack again – it isn’t gray anymore:
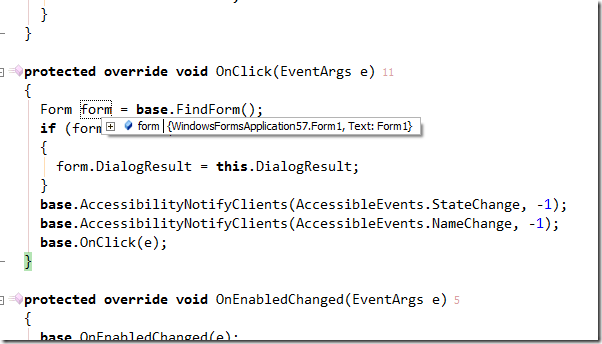
And double clicking on the BaseButton.OnClick call stack entry opens decompiled source code from DevExpress assembly with everything except the Edit&Continue feature.
Let me repeat. The code above comes from an assembly decompilation and it is almost as useful as normal source code in debugger. You can inspect the variables and step forth and back but, of course, you can’t change it. Or better, you can change it but it won’t be recompiled.
No more black boxes! Now, if this isn’t an awesome feature, a must must have one, I don’t really know what such a feature is.
There is a slight drawback though: pro version won’t be free, which isn’t a big surprise and not a big issue. The regular version will continue to be free but it won’t have the *feature*. Also currently, being in beta, there are some bugs here and there which should disappear by RTM I guess.
More (official) information on this Alex Davies’ blog post.


Yeah it looks like really nice tool, indeed. Which version-build did you use?