Does your Windows displays nice, we all love, BSOD once in a while or perhaps, god forbid, often? There are two most plausible suspects for this behavior. And no, it is rarely Windows fault. Instead it is either hardware or driver and I won’t even dig into the quality of drivers produced by various hardware companies.
But the big question here is, which one? Which driver? Which hardware? It is even harder to pinpoint the cause in case when BSOD occurs at random times. Luckily there is a tool that might shade some light on the mystery and point cyber finger at the offending driver: Microsoft Debugging Tools for Windows.
Recipe for using Debugging Tools
The recipe is shown on Windows 7 but it is very much the same for other Windows flavors.
1. Make sure your BSODs are producing memory dumps.
-
- Right click on Computer, pick Properties
- On the left side click Advanced system settings
- Select Advanced tab, you’ll see this window
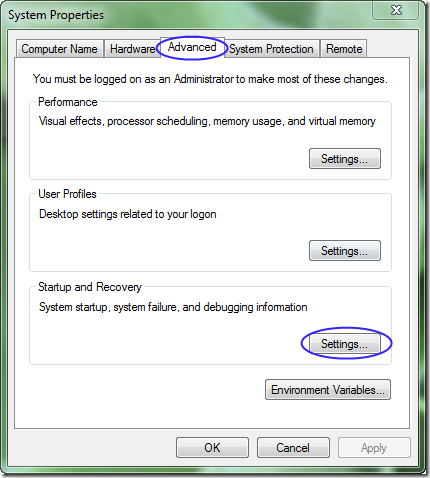
- Click Settings… button in Startup and Recovery Group to see this window
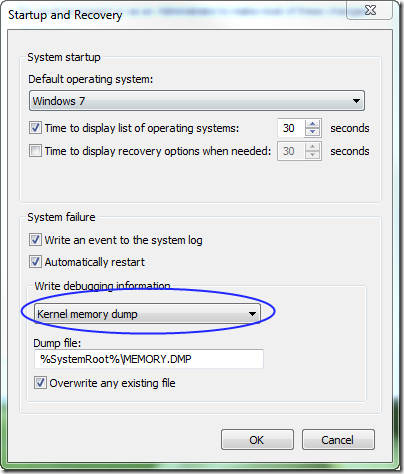
- Make sure that Kernel memory dump or at least Small memory dump (256KB) is selected (it should be on by default). That way Windows will store the forensic evidence of the crash.
2. Install appropriate (x86, x64 or Itanium) version of Microsoft Debugging Tools for Windows.
3. Run WinDbg debugger (installed as a part of package in previous step) as administrator (Right click/Run as administrator).
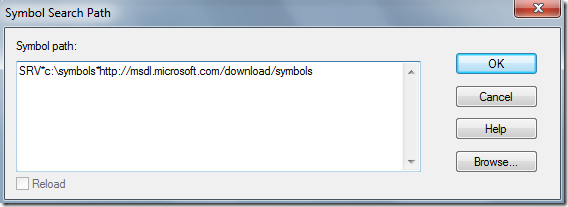
4. Setup symbols server path so the tool can output human readable information instead of hex codes.
Pick File/Symbol File Path… menu item and enter the following line into the text box:
SRV*c:\symbols*http://msdl.microsoft.com/download/symbols
This line instructs WinDbg where to download symbols from (in this case it will be public Microsoft server). Also note that c:\symbols is folder on my disk where WinDbg will cache the symbols. You are free to use whatever other folder.
Note: there are other ways for obtaining the symbols, this is just the easiest one.
5. Now you are ready for some real action. If your BSOD produced memory dump you’ll find it in C:\Windows\Minidump folder (default location). Pick File/Open Crash Dump… menu item and search for a memory dump file. Once you open a file WinDbg will present you a window like this (note, the first time it make take a while because WinDbg will download symbols from the internet): 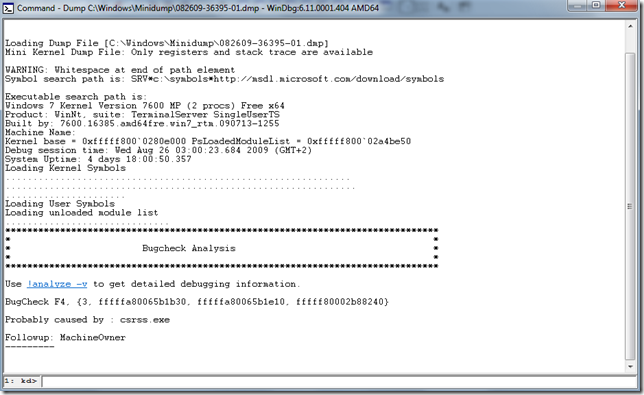
Here you’ll find the first clue of the offender, see line which starts with Probably caused by. The text probably won’t tell you much more, so here is the magic wand command.
6. Either click on !analyze –v or type it into the command line at the bottom and press enter. A better description of the error will appear such as this one: 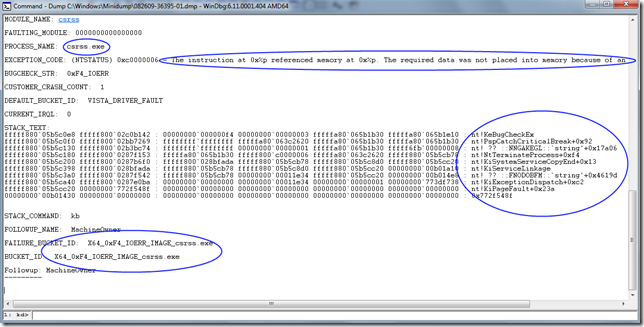
Here is a much more (human readable) information you can use to understand the cause of the BSOD. There is an offending process or driver and even a call stack. Specially the former should give you a hint who is causing the problem. Or perhaps you’ll find it in the call stack among system functions. Unfortunately the given sample is not the best one because at the moment I don’t have any better since I didn’t run into BSOD for a long time except the given sample on my wife’s computer. Csrss.exe doesn’t tell me much because the real source is hidden probably by a hardware issue. But if it was soundblaster.dll or nvidia.dll or ati.dll it would be very obvious who is the cause, wouldn’t it.
Here is my advice: search for a known dll/exe on this screen and if you find one you probably found the cause.
Well, I am not a die hard debugging guy but I often did find the cause of my BSODs this way. I am sure skilled people can use WinDbg much better than me. However often you’ll be able to understand the BSOD cause by yourself simply running WinDbg and !analyze –v command. And you’ll agree that there is no better feeling than solving such an annoying problem by yourself.
Happy hunting!
Name "Pick File/Symbol Server Path…" in actually "Pick File/Symbol [b]File[/b] Path…"
Indeed, thanks for the correction.